How can I use NPX for looking at differences between groups?
Analysis performed with NPX data works the same way as with linear data. This means all statistical tests and methods work exactly the same as they would with other data. As with all types of data, it is still important to make sure that the necessary statistical assumptions are met for the analysis being used.
One way to look at the difference between two groups is to compare the mean NPX values of those two groups. A statistical test such as a t-test (link to t-test on Wikipedia) can be used in this situation to determine if the observed difference is statistically significant. If assessing the statistical significance of more than one protein, it is important to remember to adjust p-values for multiple testing.
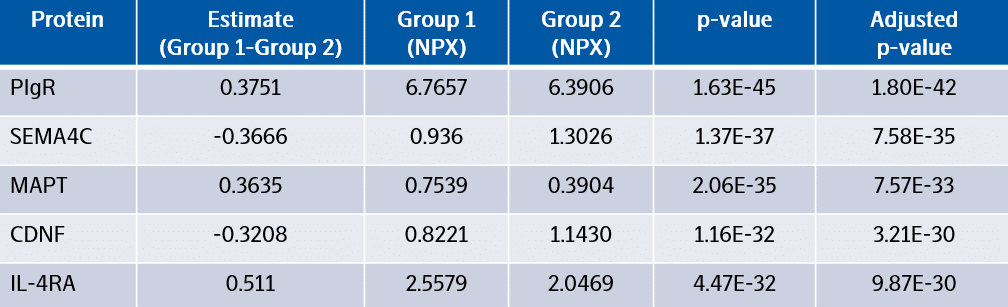
Example table of t-test performed on NPX values. The estimate is the difference in mean NPX values between the groups. P-values are adjusted for multiple testing using Benjamini Hochberg correction.
Differences between groups are often expressed as a fold-change, which is defined as the ratio between two quantities. Often the log2 of this ratio is used, as it is easy to interpret. Since NPX is on log2 scale, the difference in NPX between two groups would essentially be the same as the log2 fold change (log2(x/y) = log2x – log2y).