NPX, Normalized Protein eXpression, is Olink’s arbitrary unit which is in Log2 scale. It is calculated from Ct values and data pre-processing (normalization) is performed to minimize both intra- and inter-assay variation. NPX data allows users to identify changes for individual protein levels across their sample set, and then use this data to establish protein signatures.
The NPX scale is inverted compared to that of Ct. This means that a high NPX value equals a high protein concentration. Because NPX is in a log2 scale, a 1 NPX difference means a doubling of protein concentration. If needed NPX values can be converted into linear scale: 2NPX= linear NPX.
NPX should be used for relative quantification only. This means:
- NPX values can be compared only for the same protein across the samples analyzed in your project
- NPX values can not be compared across projects run at separate occasions without the use of reference bridging samples, for more information please see our FAQ on the matter: How can I compare results from two different studies? »
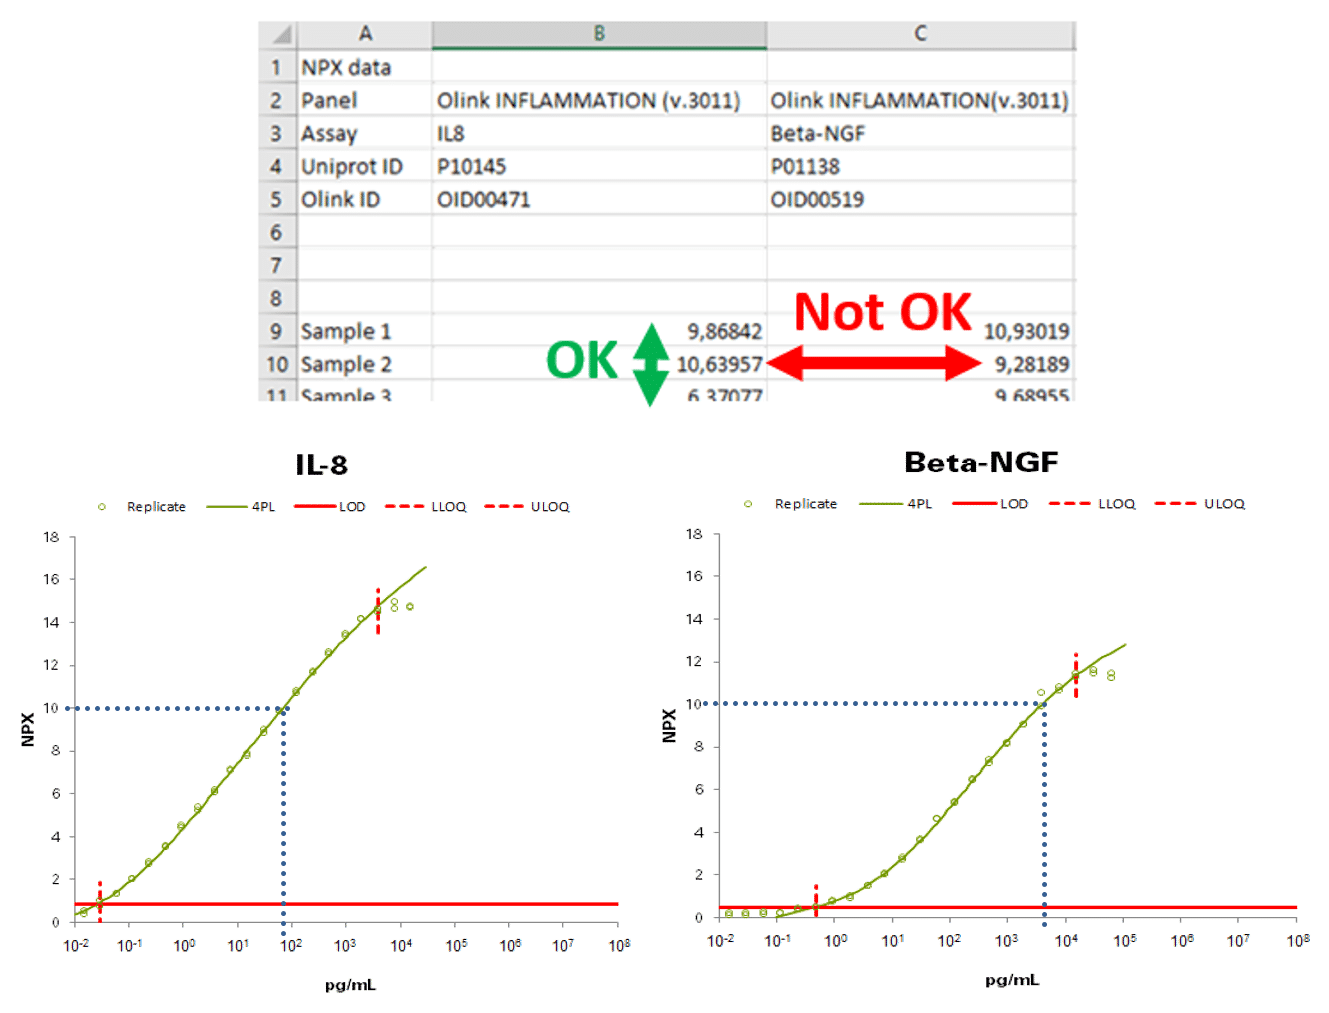
NPX values for 2 different analytes/proteins are not directly comparable. As an example in the table below, we can say that Sample 2 has a higher concentration of IL8 than Sample 1 does “OK”). We cannot say, however, that the concentration of Beta-NGF is lower than that of IL8 in Sample 2 (“Not OK”). When looking at the calibration curves produced for the validation of the assays we can see that 10 NPX as measured by our two different assays for these proteins is quite different when looking at the absolute concentration in pg/mL

Example: Visualization of NPX differences: Calibrator curves for Il-8 and Beta-NGF, generated during validation for determination of measuring range using a dilution series of purified recombinant antigen. In this example, 10 NPX is equal to 100 pg/mL for Il-8 and 10 ng/mL for Beta-NGF.