Assays with bimodal distribution for Olink® Target 96 and Olink® Explore
An assay can naturally show a bimodal distribution pattern in human plasma and serum. However, the cause of the modality can have different natures. Such as true bimodality due to different genetic phenotypes and related gene expression or apparent bimodality due to that a specific protein may rarely be detected in the circulation and only present in specific disease states. The latter is commonly the case for high-plex applications and we encourage all users, especially of the Explore HT platform to pay special attention to this phenomenon. Nevertheless, assays with bimodal distribution are recommended to be PC normalized rather than intensity normalized to maintain sample variance. The default normalization strategy in delivered data is PC normalization for Explore HT, intensity normalization for Explore 3072/384 (for multi plate projects) and intensity normalization for Target 96/48, Flex and Focus (for multi plate projects).
The following assays have been identified as assays with a bimodal distribution and should therefore always use PC/IPC normalization
| Assay | Panel |
|---|---|
| TDGF1 › | Explore NEURO Target 96 NEURO |
| FOLR3 › | Explore ONC Target 96 ONC II |
| PNLIPRP2 › | Explore ONC |
For detailed information see an example of one of the identified assays with bimodal distribution, TDGF1:
One of the assays in the Target 96 Neuro Exploratory and Explore 384 NEURO panels, TDGF1 (Teratocarcinoma-derived growth factor 1, Uniprot number: P13385), shows a strong bimodal pattern in human plasma and serum. Due to this bimodal distribution, the intensity normalization applied to all projects with randomized samples is not recommended for this marker. Therefore, the results for TDGF1 will always be delivered normalized against the Inter-Plate Controls (IPCs), or Plate Controls (PCs) for Explore, even if the remaining data in the project is intensity normalized.
Data normalization of normally distributed assays
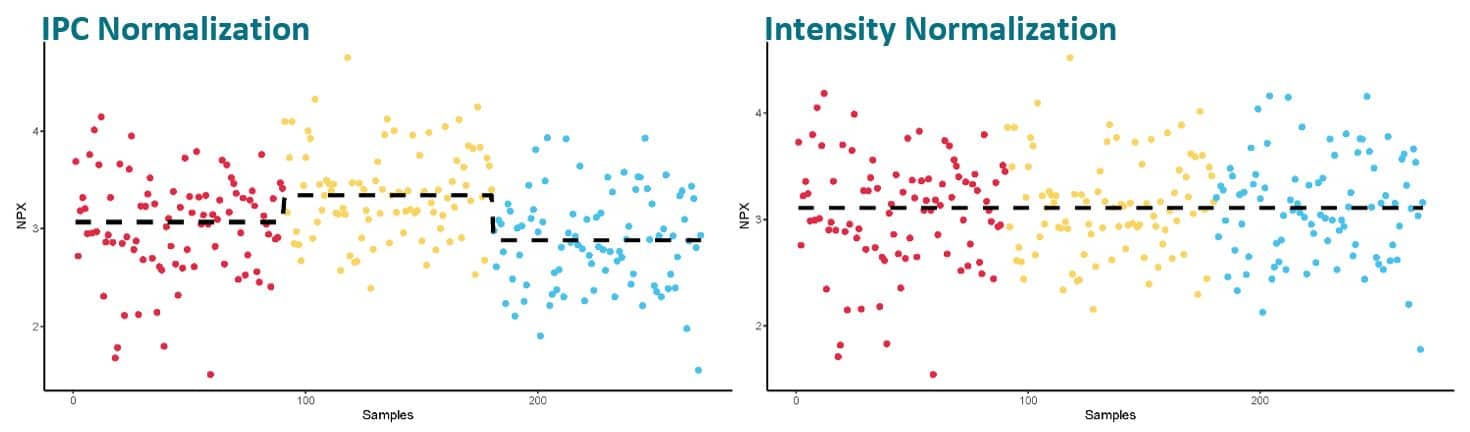
Intensity normalization of the data from an assay with normally distributed data will help reduce potential technical variation. The figures above show an example from a project spanning over 3 sample plates. Each color indicates a different plate and the plate median is visualized by a dotted line. Using the IPC™s for normalization produces good data, but for a study with randomized samples where the plate median for each assay can be assumed to be the same over all plates, the added intensity normalization will help cancel out technical variations to a higher degree.
Data normalization of TDGF1
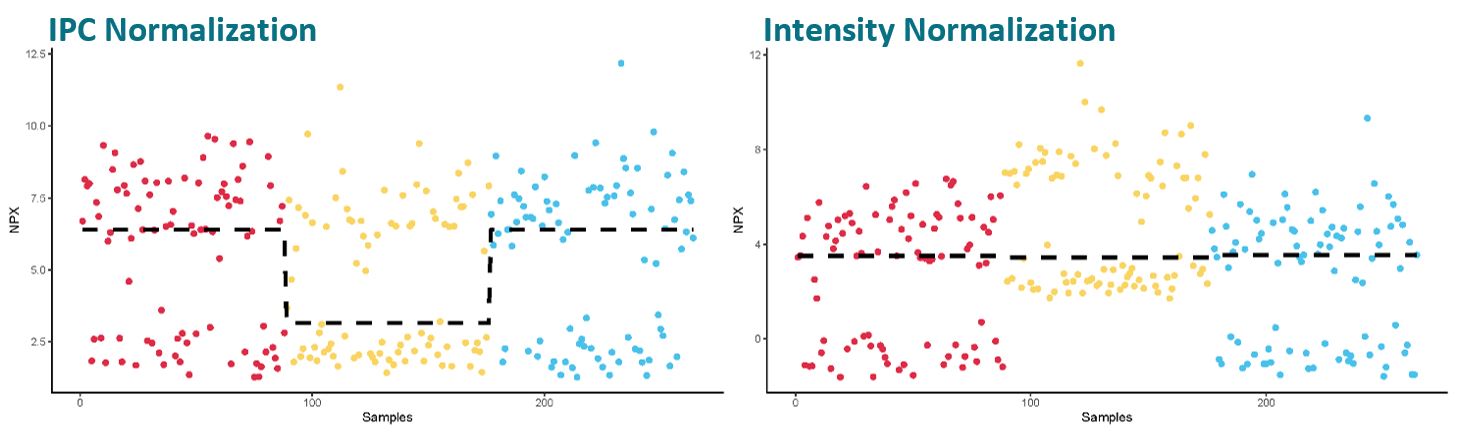
Unlike when the data of a normally distributed assay is intensity normalized, intensity normalization of TDGF1 data can increase the variation between plates rather than eliminate it. As the distribution of samples between the two groups (the high vs. the low group) is almost 50-50, one or a few samples more in one of the groups on a plate will skew the plate median upon which we base the intensity normalization. I.e. a few samples more in the group with high values will result in a higher plate median compared to a plate with a few more samples in the group with low values.
Using intensity normalization for this assay will therefore introduce more variation rather than decrease technical variation, and potentially biologically interesting findings cannot be seen as clearly. Please also be careful in the downstream processing of assays with bimodal distribution, since standard parametric methods are not applicable.
Links
How is the data pre-processed? FAQ
For more information see our white paper, Data normalization and standardization.